Migration into early medieval England did not happen in a single burst and then stop. A new large-scale study argues that movement remained a consistent feature of life between the end of Roman rule and the eve of the Norman Conquest, with tooth enamel chemistry and ancient DNA offering a clearer view of who was moving, when, and how patterns differed by sex and region.
“The study took a ‘big data’ approach to assess the narratives around early medieval migration,” explains Sam Leggett of the University of Edinburgh and one of the authors of the study. “We see here that migration was a consistent feature rather that just tied to one off events, with evidence of communities in continual cross-cultural contact, tied into large scale networks which may have contributed to the major socio-cultural changes we see throughout the period.”
The research, which is published in Medieval Archaeology, draws on 700 tooth-enamel isotope measurements from England in the first millennium AD and compares those results with ancient DNA datasets, including 316 individuals used to contrast movement and ancestry.
A clearer count of mobility
One of the study’s most useful contributions is that it puts real numbers on how often people seem to have moved. Looking at chemical clues locked into tooth enamel, the researchers identify 296 people whose childhood signatures do not match the area where they were buried—about 42% of the total sample.
Photo of Dr Sam Leggett in the lab in Edinburgh drilling tooth enamel for analysis. Credit: Dr Sam Leggett
Most of that comes from oxygen measurements: 273 individuals stand out as likely to have grown up somewhere with noticeably different drinking water than the place they ended up. A smaller set shows unusual strontium values in their enamel, which can point to people raised on very different geology. In a handful of cases, the authors suggest these patterns fit well with newcomers from Scandinavia in the later part of the period.
How the study decides who counts as “local”
To avoid comparing apples to oranges between different regions, the researchers don’t just look at a person’s raw isotope number. Instead, they compare each person’s enamel signal to what would normally be expected for the local environment at the burial site. If someone’s value sits well outside the typical local range, they are treated as more likely to have spent childhood elsewhere.
The authors also emphasise an important caveat: some migrants will still look “local.” If someone moved from a place with similar rainfall and geology, the chemistry in their enamel may not stand out—so this method can miss some kinds of movement even when migration happened.
A spike in mobility after the traditional “migration” window
Mobility was not evenly distributed over time. The study identifies the late 6th to late 8th centuries as a period of heightened movement, with “non-locals” rising from 38% to 47%.
Timeline of major events in early medieval England that are discussed in the article and documented in the bioarchaeological record. Credit: Created in BioRender. Leggett, S. (2026) https://BioRender.com/m0yra28 under a CC-BY-4.0 license
“Our study shows that migration to Britain was fairly continuous throughout the first millennium,” adds Susanne Hakenbeckof the University of Cambridge. “We didn’t expect to see a spike in mobility in the 7th and 8th centuries – well after the period of the so-called Anglo-Saxon migrations. This study – incidentally co-authored by two migrants – also shows that Britain was never isolated from the continent.”
Climate signals in teeth, and what they can (and can’t) explain
Because tooth enamel forms in childhood, it can preserve a chemical snapshot of the water someone drank while growing up. Over long periods, that signal can shift not only because people moved, but also because climate patterns changed.
The researchers suggest that part of the study’s changing oxygen results may reflect the Late Antique Little Ice Age, a spell of cooler conditions beginning in the mid-sixth century. In other words, some people can look as if they grew up in colder environments even if they stayed put, simply because the climate was different when they were children.
Migration and climate change as shown in oxygen isotopes from human tooth enamel. Credit: Dr Sam Leggett, adapted from Figure 1 in the journal article (https://doi.org/10.1080/00766097.2025.2583016 under a CC-BY 4.0)
But the paper is careful not to blame everything on climate. It points out that some individuals with these “colder” signals died later, and—based on their ages—would not have been children during that cooling phase. For them, the more likely explanation is movement from colder regions rather than a local climate effect.
In later centuries, the pattern can flip again. The study notes that some “warmer” oxygen signals could reflect the Medieval Climate Anomaly, a period of relatively warmer conditions, but it also considers other possibilities—especially food and drink habits that can shift the chemical signal people take in. The authors point to practices like brewing and cooking that can change the water signature in what people consume, meaning a person’s enamel can sometimes reflect daily habits as much as geography.
Gendered mobility, shifting over time
One of the study’s key arguments is that migration did not affect everyone in the same way. When the researchers separate the tooth-enamel data by biological sex and broad time period, they say it reveals “sex-based differences in mobility” and shows that the balance of “local” and “non-local” people changes over the centuries.
In the Roman period, the patterns for men and women look noticeably different. The study finds that men are more likely to show chemical signals consistent with having grown up somewhere else, including signs that point beyond southern Britain.
Map showing the proportions of locals and non-locals in areas of Early Medieval England where <-2‰ are migrants from colder climates, and >+2‰ are either migrants from warmer climates or people impacted by “brewing and stewing” effects. Credit: adapted from Figure 3 in the journal article (https://doi.org/10.1080/00766097.2025.2583016 under a CC-BY 4.0 license)
Between c. AD 350 and 790, those differences become much less obvious. Men and women look more alike overall, although the authors still observe a small tilt: slightly more women fall within the “local” range, while more men fall outside it—evidence that, at least in this dataset, men may have been somewhat more likely to move long distances.
The strongest contrast appears from the late eighth century onwards. Here, men show a much wider spread in the isotope results, and the study links several of the most striking male outliers to patterns consistent with Scandinavian origins.
Women in the later period stand out in a different way. The paper suggests that some female “warmer” oxygen signals could reflect either changes in what people were drinking (including effects connected to ale or beer production) and/or movement from places with more enriched oxygen values, such as southern Europe or parts of the western Atlantic archipelago, including Wales, Ireland, and Cornwall.
Regional histories, and why the map isn’t uniform
The study argues that there is no single, nationwide “migration pattern” for early medieval England. Instead, mobility looks different depending on where you are, and even neighbouring regions can show contrasting signals.
In Kent/East Sussex and Wessex, the researchers see a clear split in the oxygen results, with two clusters rather than one. They suggest this kind of “bimodal” pattern fits best with people arriving from more than one kind of childhood environment—in other words, communities drawing in newcomers from at least two different source regions, not just a single corridor of movement.
The authors also warn that apparent quiet zones on the map can simply reflect where the data are thin. East Anglia, for example, shows fewer people with very low oxygen values, but the study cautions that enamel sampling from the region is limited. On top of that, some migrants—especially from parts of north-western Europe—may be difficult to detect with oxygen isotopes because their childhood water signatures can look very similar to those found in Britain.
Where regional patterns do stand out, the study stresses that they can be strongly shaped by local social histories. In the Upper Thames and Chilterns, the male data cover a wider spread, while female values cluster tightly, which the authors read as a sign that women there were more likely to have grown up locally while a larger share of men arrived from elsewhere.
In the North East, the results point in a different direction. Most men fall inside the expected “local” range, while the female distribution includes slightly more individuals with high oxygen values. The authors offer two possibilities: that these signals reflect local food-and-drink practices that alter oxygen values, or that they represent a notable number of incoming women—a reminder that the same isotope pattern can sometimes have more than one plausible explanation.
🌟New Year exciting new OA paper🌟 doi.org/10.1080/0076… from myself @hcaatedinburgh.bsky.social, @shakenbeck.bsky.social & TC O’Connell @cam-archaeology.bsky.social “Large-Scale Isotopic Data Reveal Gendered Migration into Early Medieval England c ad 400–1100” using #isotopes & #aDNA🧵⬇️ 1/
The authors also connect their findings to how migration is taught and discussed more widely. They conclude:
This necessitates a serious rethink of over-simplified traditional narratives of migration and cross-cultural contact in post-Roman Britain which are heavily politicised and embedded in the English national curriculum. We see here dynamic communities in continual cross-cultural contact, tied into large-scale networks which facilitated the major socio-cultural changes we see throughout the period. The introduction of biomolecular data to this topic readjusts the conversation about migration in a significant way, and with more studies integrating aDNA and isotopic proxies at high resolution, we will be able to tackle different questions and move on from old debates.
The article, “Large-Scale Isotopic Data Reveal Gendered Migration into Early Medieval England c AD 400–1100,” by Sam Leggett, Susanne Hakenbeck and Tamsin C O’Connell, is published in Medieval Archaeology. Click here to read it.
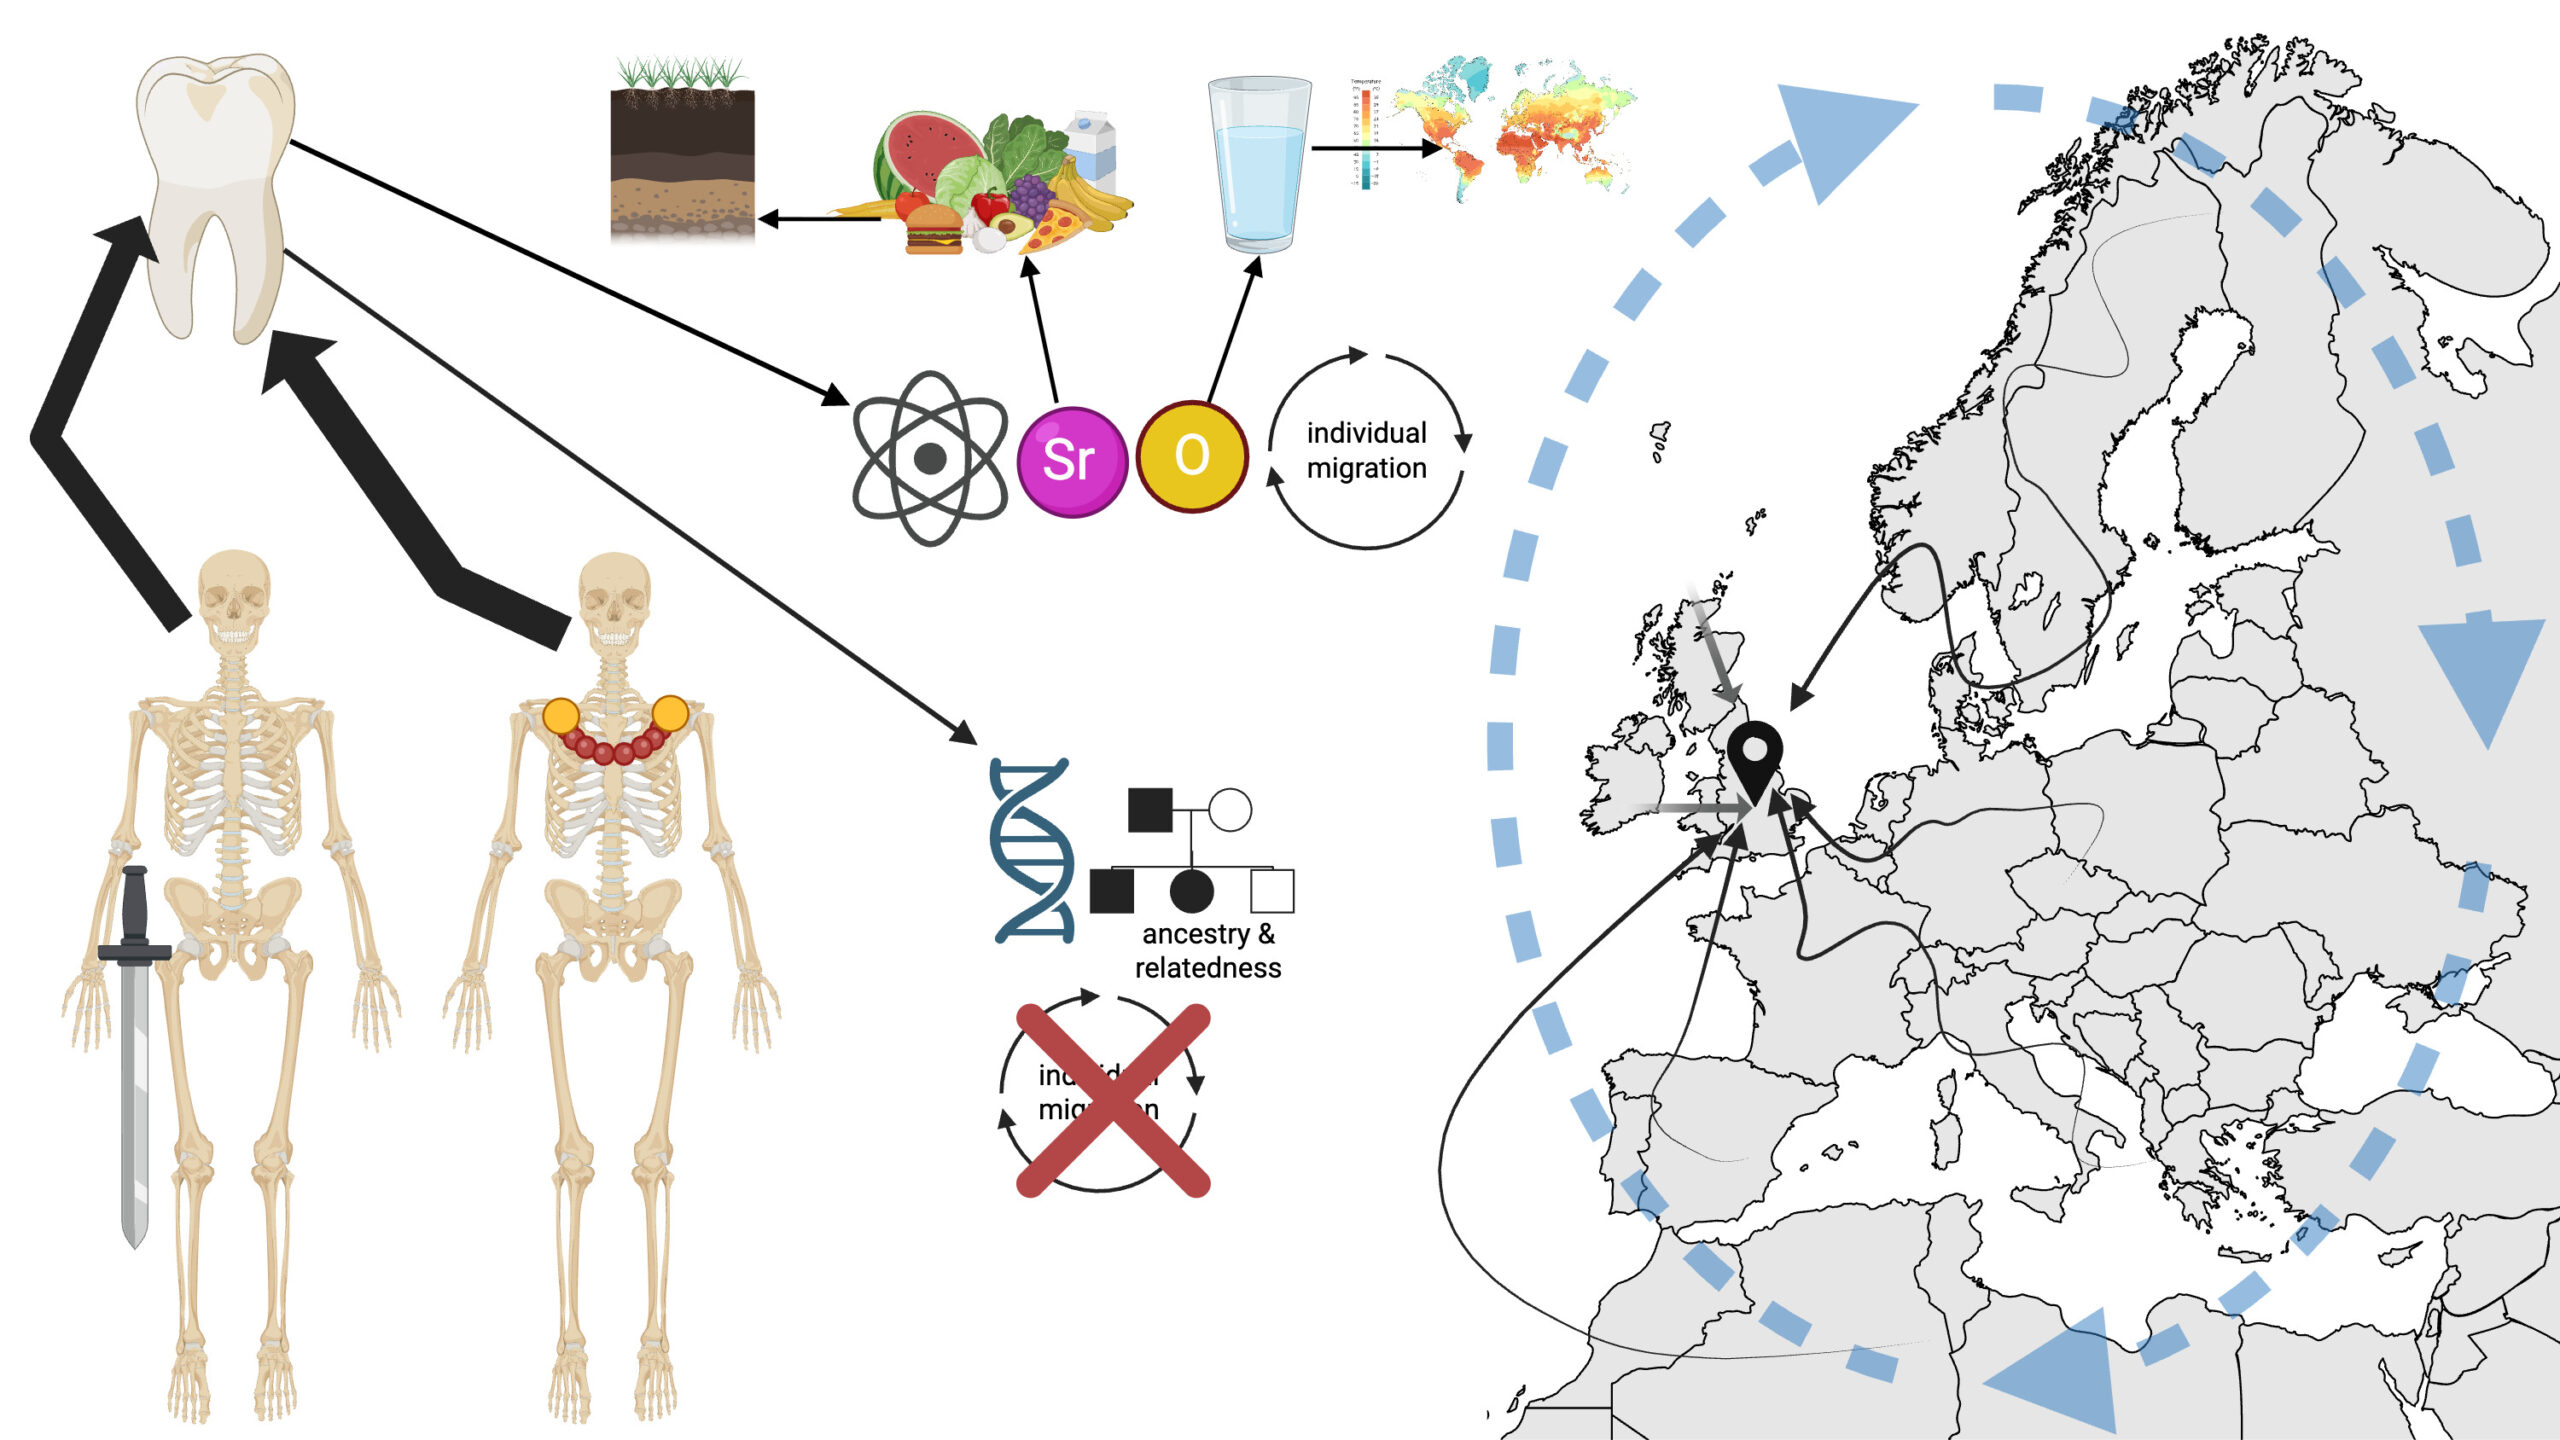
Top Image: Isotopes and ancient DNA from early medieval skeletons show large-scale migration into England, but also throughout Europe. Ancient DNA tells us about genetic relationships and long-term ancestry. Whilst isotopes link back to where food and water came from, telling us if and when someone has migrated during their life. Credit: Created in BioRender. Leggett, S. (2026) https://BioRender.com/hhbg2cd under a CC-BY-4.0 license
Migration into early medieval England did not happen in a single burst and then stop. A new large-scale study argues that movement remained a consistent feature of life between the end of Roman rule and the eve of the Norman Conquest, with tooth enamel chemistry and ancient DNA offering a clearer view of who was moving, when, and how patterns differed by sex and region.
“The study took a ‘big data’ approach to assess the narratives around early medieval migration,” explains Sam Leggett of the University of Edinburgh and one of the authors of the study. “We see here that migration was a consistent feature rather that just tied to one off events, with evidence of communities in continual cross-cultural contact, tied into large scale networks which may have contributed to the major socio-cultural changes we see throughout the period.”
The research, which is published in Medieval Archaeology, draws on 700 tooth-enamel isotope measurements from England in the first millennium AD and compares those results with ancient DNA datasets, including 316 individuals used to contrast movement and ancestry.
A clearer count of mobility
One of the study’s most useful contributions is that it puts real numbers on how often people seem to have moved. Looking at chemical clues locked into tooth enamel, the researchers identify 296 people whose childhood signatures do not match the area where they were buried—about 42% of the total sample.
Most of that comes from oxygen measurements: 273 individuals stand out as likely to have grown up somewhere with noticeably different drinking water than the place they ended up. A smaller set shows unusual strontium values in their enamel, which can point to people raised on very different geology. In a handful of cases, the authors suggest these patterns fit well with newcomers from Scandinavia in the later part of the period.
How the study decides who counts as “local”
To avoid comparing apples to oranges between different regions, the researchers don’t just look at a person’s raw isotope number. Instead, they compare each person’s enamel signal to what would normally be expected for the local environment at the burial site. If someone’s value sits well outside the typical local range, they are treated as more likely to have spent childhood elsewhere.
The authors also emphasise an important caveat: some migrants will still look “local.” If someone moved from a place with similar rainfall and geology, the chemistry in their enamel may not stand out—so this method can miss some kinds of movement even when migration happened.
A spike in mobility after the traditional “migration” window
Mobility was not evenly distributed over time. The study identifies the late 6th to late 8th centuries as a period of heightened movement, with “non-locals” rising from 38% to 47%.
“Our study shows that migration to Britain was fairly continuous throughout the first millennium,” adds Susanne Hakenbeck of the University of Cambridge. “We didn’t expect to see a spike in mobility in the 7th and 8th centuries – well after the period of the so-called Anglo-Saxon migrations. This study – incidentally co-authored by two migrants – also shows that Britain was never isolated from the continent.”
Climate signals in teeth, and what they can (and can’t) explain
Because tooth enamel forms in childhood, it can preserve a chemical snapshot of the water someone drank while growing up. Over long periods, that signal can shift not only because people moved, but also because climate patterns changed.
The researchers suggest that part of the study’s changing oxygen results may reflect the Late Antique Little Ice Age, a spell of cooler conditions beginning in the mid-sixth century. In other words, some people can look as if they grew up in colder environments even if they stayed put, simply because the climate was different when they were children.
But the paper is careful not to blame everything on climate. It points out that some individuals with these “colder” signals died later, and—based on their ages—would not have been children during that cooling phase. For them, the more likely explanation is movement from colder regions rather than a local climate effect.
In later centuries, the pattern can flip again. The study notes that some “warmer” oxygen signals could reflect the Medieval Climate Anomaly, a period of relatively warmer conditions, but it also considers other possibilities—especially food and drink habits that can shift the chemical signal people take in. The authors point to practices like brewing and cooking that can change the water signature in what people consume, meaning a person’s enamel can sometimes reflect daily habits as much as geography.
Gendered mobility, shifting over time
One of the study’s key arguments is that migration did not affect everyone in the same way. When the researchers separate the tooth-enamel data by biological sex and broad time period, they say it reveals “sex-based differences in mobility” and shows that the balance of “local” and “non-local” people changes over the centuries.
In the Roman period, the patterns for men and women look noticeably different. The study finds that men are more likely to show chemical signals consistent with having grown up somewhere else, including signs that point beyond southern Britain.
Between c. AD 350 and 790, those differences become much less obvious. Men and women look more alike overall, although the authors still observe a small tilt: slightly more women fall within the “local” range, while more men fall outside it—evidence that, at least in this dataset, men may have been somewhat more likely to move long distances.
The strongest contrast appears from the late eighth century onwards. Here, men show a much wider spread in the isotope results, and the study links several of the most striking male outliers to patterns consistent with Scandinavian origins.
Women in the later period stand out in a different way. The paper suggests that some female “warmer” oxygen signals could reflect either changes in what people were drinking (including effects connected to ale or beer production) and/or movement from places with more enriched oxygen values, such as southern Europe or parts of the western Atlantic archipelago, including Wales, Ireland, and Cornwall.
Regional histories, and why the map isn’t uniform
The study argues that there is no single, nationwide “migration pattern” for early medieval England. Instead, mobility looks different depending on where you are, and even neighbouring regions can show contrasting signals.
In Kent/East Sussex and Wessex, the researchers see a clear split in the oxygen results, with two clusters rather than one. They suggest this kind of “bimodal” pattern fits best with people arriving from more than one kind of childhood environment—in other words, communities drawing in newcomers from at least two different source regions, not just a single corridor of movement.
The authors also warn that apparent quiet zones on the map can simply reflect where the data are thin. East Anglia, for example, shows fewer people with very low oxygen values, but the study cautions that enamel sampling from the region is limited. On top of that, some migrants—especially from parts of north-western Europe—may be difficult to detect with oxygen isotopes because their childhood water signatures can look very similar to those found in Britain.
Where regional patterns do stand out, the study stresses that they can be strongly shaped by local social histories. In the Upper Thames and Chilterns, the male data cover a wider spread, while female values cluster tightly, which the authors read as a sign that women there were more likely to have grown up locally while a larger share of men arrived from elsewhere.
In the North East, the results point in a different direction. Most men fall inside the expected “local” range, while the female distribution includes slightly more individuals with high oxygen values. The authors offer two possibilities: that these signals reflect local food-and-drink practices that alter oxygen values, or that they represent a notable number of incoming women—a reminder that the same isotope pattern can sometimes have more than one plausible explanation.
The authors also connect their findings to how migration is taught and discussed more widely. They conclude:
This necessitates a serious rethink of over-simplified traditional narratives of migration and cross-cultural contact in post-Roman Britain which are heavily politicised and embedded in the English national curriculum. We see here dynamic communities in continual cross-cultural contact, tied into large-scale networks which facilitated the major socio-cultural changes we see throughout the period. The introduction of biomolecular data to this topic readjusts the conversation about migration in a significant way, and with more studies integrating aDNA and isotopic proxies at high resolution, we will be able to tackle different questions and move on from old debates.
The article, “Large-Scale Isotopic Data Reveal Gendered Migration into Early Medieval England c AD 400–1100,” by Sam Leggett, Susanne Hakenbeck and Tamsin C O’Connell, is published in Medieval Archaeology. Click here to read it.
Top Image: Isotopes and ancient DNA from early medieval skeletons show large-scale migration into England, but also throughout Europe. Ancient DNA tells us about genetic relationships and long-term ancestry. Whilst isotopes link back to where food and water came from, telling us if and when someone has migrated during their life. Credit: Created in BioRender. Leggett, S. (2026) https://BioRender.com/hhbg2cd under a CC-BY-4.0 license
Subscribe to Medievalverse
Related Posts